Download: Russell 3000 Companies – Excel file with the Top 3000 US companies data
Browse, filter, and use data easily on the Top 3000 companies listed in the United States, constituents of the Russell 3000 index – aggregate of the Russell 1000 (large and mid-cap companies) and Russell 2000 indices (small-cap companies). Get all the information on top companies in key US indices: Dow Jones, Nasdaq-100, S&P 500, Russell 1000, Russell 2000, and Russell 3000.
Download description
This Excel file contains a giant actionable spreadsheet.
The main list of Russell 3000 companies Excel spreadsheet includes all the key data on each company. These top 3000 largest public listed companies by market capitalization in the United States, constituents of the Russell 3000 Index (formed of large and mid-caps from the Russell 1000 index, and small-caps from the Russell 2000 index), are detailed with extensive business, market, digital, and financial information.
The entire Russell 3000 companies list, and their related data, can easily be browsed and filtered according to your specific purposes: grouping by sectors/industries/indices, location, ranking by market capitalization, sorting websites, etc.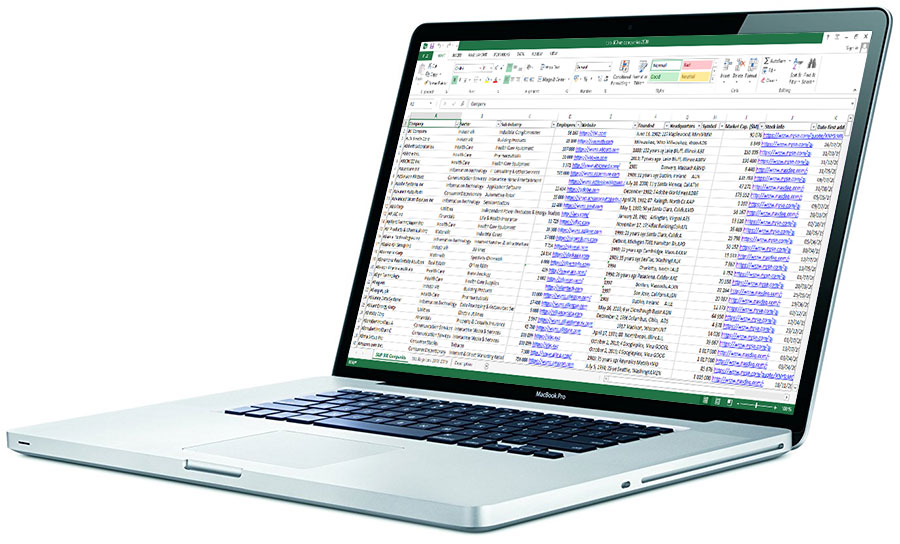
This main spreadsheet contains information on the Russell 3000 companies listed on the New York Stock Exchange and Nasdaq Stock Market and their related data. As a bonus, the spreadsheet also includes data on the companies in the S&P 500 and NASDAQ-100 indices that were not included in the Russell 3000 index at the time of creation.
Since the Russell 3000 index is an aggregate of the Russell 1000 and Russell 2000 indices, this Excel download contains all the data included in our two other Excel downloads corresponding to each sub-index in a single Excel file with more than 3000 companies. Thanks to this unique Russell 3000 download, you can obtain all the data in both files for the price of $159.90, instead of $189.80 if you purchase each document separately, and save $29.90!
Data included in the Top 3000 US Companies [Russell 3000] – Excel Download:
✅ Key benefits from the Russell 3000 Companies Excel Download [Top 3000 US Companies]
- Quickly browse and filter the companies’ information in a single convenient Excel file for multiple purposes, including:
- corporate benchmarking for marketing, finance, and investment
- searching and filtering companies for informed lead generation
- quickly reaching companies’ websites and online presence in bulk
- using stocks data to perform cross-stocks analysis, statistics, and machine learning for financial and investment insights
- Keep all the information readily available on your computer at any time, even offline.
- Easily use the companies’ data in other applications and programs thanks to a standard Excel file (.xls/.xlsx).
- Save tens of hours of companies’ information search, collection, and formatting in one convenient Excel file.
- Use data to boost your productivity and discover decisive insights, NOW!
Featured Review
Kenneth Lewis – Marketing & Sales Manager, Consulting & Audit
⭐⭐⭐⭐⭐
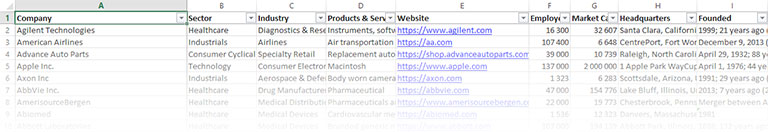
 To let you know exactly what the Russell 3000 Companies spreadsheet contains, you can here download a free sample. This extract of both spreadsheets includes all the data of the first 6 companies, together with the explanatory notes of the description spreadsheet. For more information about each column data, please see below.
Details of the main Russell 3000 companies list Excel spreadsheet data
Here is a presentation of all the information included in each column of the main Russell 3000 Companies XLS spreadsheet. This detailed data can be sorted and filtered according to each column with a filter button present in the right of the columns’ headings cells.
All data included in the main spreadsheet are updated as of May 2024
Company Data
First 27 columns, to column “AA” included.
Company
Official company name. Certain companies are included multiple times when they have multiple securities listed on US stock exchanges.
Ticker
Stock ticker (symbol) of the company. Companies with multiple stocks listed also have multiple, different tickers, one for each kind of stock.
Sector
Main economic sector of the company.
Industry
Main industry of the company.
Country
Country of the main headquarter of the company. Some companies headquartered in a particular country may have stocks listed in other countries exchanges, and included in the local stock index.
City
City of the main headquarter of the company.
State/Province
State/Province code of the main headquarter of the company, when they are headquartered in the United States or in Canada and Australia.
Website
URL of the company’s main corporate website with a direct link.
Currency
Currency of the “Market Cap. Local” column and financial reports columns hereafter
Market Cap. Local
Market capitalization of the company’s currency, as of effective close on Sunday, May 5, 2024. Companies with multiple securities included may present a discrepancy between their valuation according to each security.
Market Cap. USD
Market capitalization of the company in US $, as of effective close on Sunday, May 5, 2024. Companies with multiple securities included may present a discrepancy between their valuation according to each security.
Logo URL
URL with direct link to the logo of the company on Clearbit.
Products & Services
Main products and/or services of the company.
Foundation
Date or year of the foundation of the company. Some companies have more information included on their founding companies, renaming, key mergers, etc.
Founder(s)
Original company’s founder(s).
CEO
Company CEO
Employees
Approximate total number of full-time employees in the company.
Description
Description of the company and its activities
Social media
Social media profiles URL with direct links (1 column per network):
Facebook | X (Twitter) | LinkedIn
Contacts
Contact details of the company: Address, with secondary info in the column “Address (line 2)”, Zip code, and Phone number, each in their own column.
Wikipedia
URL with direct link to the company’s main page on Wikipedia.
Note
Notes on some companies with missing data, or special listings. These notes mostly highlight companies that have been acquired by others since the last inscription in a specific index.
Stock & Financial Data
All remaining columns. Beta, trailing_pe, forward_pe, price_to_sales_ttm, price_to_book_mrq, enterprise_value, enterprise_to_revenue, and enterprise_to_ebitda are recorded as of Sunday, May 5, 2024. Other stock and financial data are recorded as of the most recent quarter reports date (“most_recent_quarter” column).
Stock Exchange
Stock exchange of the security. Companies with multiple stocks listed also can be listed on multiple stock exchanges.
Stock Info
URL of the company’s security chart and information on Disfold with direct link.
Stock Index(es)
Stock Index(es) in which the security is included. Certain mutually exclusive and related indices are included in the same column:
- Dow Jones
- S&P 500
- NASDAQ-100
- Russell 1000
- Russell 2000
- Russell 3000
beta
Measure of the stock’s volatility in relation to the primary benchmark (index) of the country.
trailing_pe
Trailing price-to-earnings (P/E), calculated by taking the current stock price and dividing it by the trailing earnings per share (EPS) for the past 12 months
forward_pe
Forward price-to-earnings ratio, calculated by dividing the current share price by the estimated future earnings per share
price_to_sales_12m
The price-to-sales (P/S) ratio is a valuation ratio that compares the market capitalization to its revenues over the last 12 months
price_to_book_mrq
The price-to-book (P/B) ratio is equal to the current share price divided by the book value of all shares (BVPS) over the last quarter
enterprise_value
The enterprise value (EV) of the company, often used as a more comprehensive alternative to market capitalization
enterprise_to_revenue
The enterprise value-to-revenue multiple (EV/R) is a measure that compares enterprise value to revenue
enterprise_to_ebitda
The enterprise value-to-ebitda multiple (EV/EBITDA) is a measure that compares enterprise value to EBITDA
fiscal_year_ends
Date of completion of the most recent 12-month accounting period
most_recent_quarter
The most recent quarter (MRQ) is to the fiscal quarter that most recently ended, for which values are recorded here.
profit_margin
Gross profit margin, calculated by dividing net income by sales revenue
operating_margin
The operating margin is calculated by dividing operating income by net sales
return_on_assets_12m
Return on assets (ROA) is calculated by dividing net income by total assets over the last 12 months
return_on_equity_12m
Return on equity (ROE) is calculated by dividing net income by average shareholders’ equity over the last 12 months
revenue_12m
Total revenue over the last 12 months
revenue_per_share_12m
Revenue per share over the last 12 months
quarterly_revenue_growth
Quarterly revenue growth year over year
gross_profit_12m
Gross profit over the last 12 months
ebitda
EBITDA (earnings before interest, taxes, depreciation, and amortization) measure; EBITDA is not calculated for banks.
net_income_to_common_12m
Net income applicable to common shares over the last 12 months
diluted_eps_12m
Diluted EPS measure over the last 12 months
quarterly_earnings_growth_yoy
Quarterly earnings growth year over year
total_cash_mrq
Total cash measure for the most recent quarter
total_cash_per_share_mrq
Total cash per share measure for the most recent quarter
total_debt_mrq
Total debt measure for the most recent quarter
total_debt_to_equity_mrq
Total debt to equity measure for the most recent quarter
current_ratio_mrq
Current ratio (total assets / total liabilities) ratio for the most recent quarter
book_value_per_share_mrq
Book value per share (BVPS) ratio for the most recent quarter
operating_cash_flow_12m
Operating cash flow measure over the last 12 months
levered_free_cash_flow_12m
Levered free cash flow measure over the last 12 months
percent_held_by_insiders
Percentage of shares held by the company insiders
percent_held_by_institutions
Percentage of shares held by the institutions
forward_annual_dividend_rate
Forward dividend yield estimation in the currency of the stock
forward_annual_dividend_yield
Forward dividend yield percentage relative to stock price
trailing_annual_dividend_rate
Trailing dividend yield rate in the currency of the stock over the last 12 months
trailing_annual_dividend_yield
Trailing dividend yield percentage relative to stock price
payout_ratio
The payout ratio shows the proportion of earnings a company pays its shareholders in the form of dividends
dividend_date
Last dividend payout date
ex_dividend_date
Last ex-dividend payout date
last_split_factor
Specification of the last split event
last_split_date
Last split date
“N/A” or blank cell: data not available at the time of the creation. In certain cells, a “0” value also indicates blank or unavailable data.
For a complete preview, download the free spreadsheet sample.
Download technical details
 Type: Excel file (.xlsx)
- Size: 3.87 Mo
- Spreadsheets: 2
- 1 sheet containing the Russell 3000 Companies 2024 information with filters
- 1 sheet with the detailed description of the data included in the other spreadsheet
- Author/Editor: Disfold


![Top 1200 UK Companies [FTSE All-Share + FTSE AIM All-Share] – Excel Download](http://store.disfold.com/wp-content/uploads/sites/11/2024/05/top-1200-uk-companies-ftseallshare-aimallshare-small.jpg)
![Top 500 Australian Companies [All Ordinaries] – Excel Download](http://store.disfold.com/wp-content/uploads/sites/11/2021/04/top-500-australian-companies-allordinaries-small.jpg)